U.S. States That Spend the Most on Health & Hospitals

The challenges facing the healthcare sector in the U.S. are numerous. The U.S. lags behind other developed nations on many key metrics of health, including life expectancy, chronic disease burden, and avoidable deaths. The population has been growing older on average with the aging of the Baby Boomers, creating increased demand for health services. Longtime public health challenges like obesity, substance abuse, and mental illness have wide-ranging impacts on Americans’ overall health and well-being. And in the last few years, the COVID-19 pandemic has placed unusually heavy strain on healthcare providers and hospitals.
With these many interlocking and compounding challenges, the U.S. spends heavily to support the healthcare system. According to federal data, national health expenditures in the U.S. total $4.1 trillion per year, making up nearly 20% of the nation’s GDP. The bulk of this spending comes from the federal government, which contributes 36.3% of expenditures, and U.S. households, which account for 26.1%.
Often underappreciated in discussions of the U.S. health system is the role of state and local governments. States and localities frequently fund public hospitals, health inspections, mental health and substance abuse programs, water and air quality programs, and payments to private hospitals for public health services. State and local governments funded 14.3% of total national health expenditures in 2020.
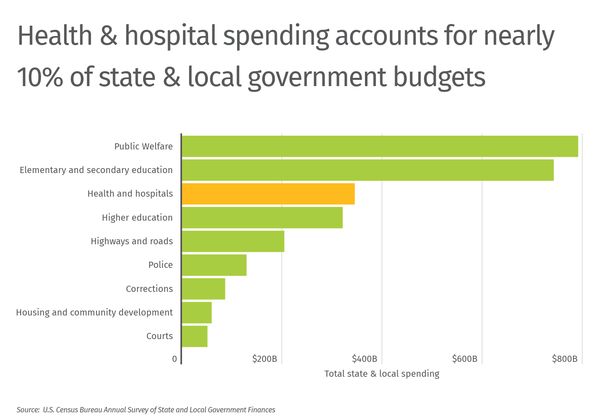
This spending is one of the most significant budgetary responsibilities of state and local governments. Health and hospitals represent the third largest spending category for state and local governments, behind only public welfare and elementary and secondary education. Collectively, governments spend $345 billion on health and hospitals each year, accounting for nearly 10% of all state and local spending.
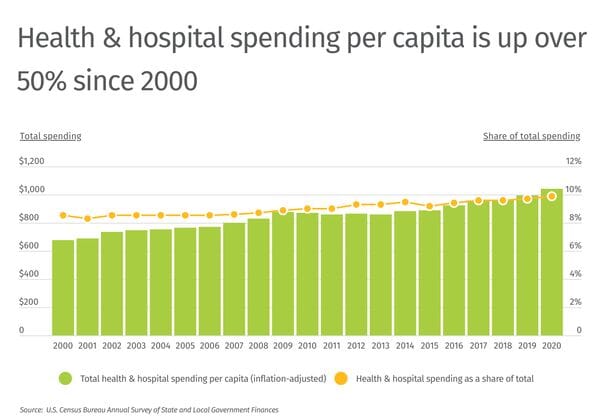
State and local spending on health and hospitals on a per-capita basis has also grown over time. In the year 2000, state and local governments spent $678 per capita on health and hospitals in inflation-adjusted dollars. By 2020, that figure had risen to $1,040—an increase of more than 50%.
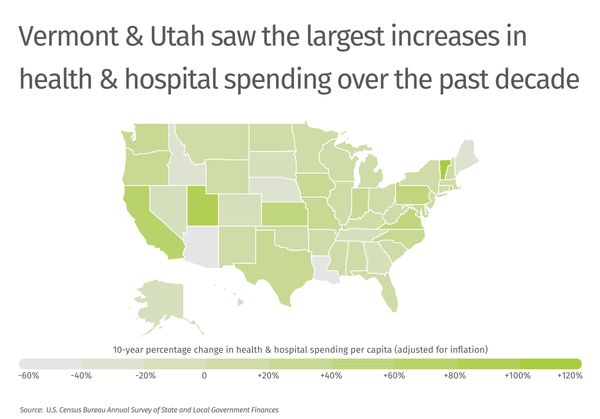
However, this trend has not played out the same in all locations. In fact, 13 states have seen a decline in health and hospital spending per capita over the last decade, led by Arizona, where spending has declined by more than 50%. In contrast, other states have seen rapid growth in health spending. Vermont’s inflation-adjusted state and local spending per capita more than doubled between 2010 and 2020, from $355 to $730, and Utah’s 96.2% rate of growth was not far behind.
Just as trends in health spending have varied by geography, total spending also looks different from state to state. Nationwide, states and localities spend around 9.9% of their budgets on health and hospitals, at a total of $1,047 per capita. But a number of states and localities spend well above these figures, including Wyoming, where the per-capita spending is nearly triple the national average, and South Carolina, where health and hospital spending represents nearly 20% of state and local expenditures.
The data used in this analysis is from the U.S. Census Bureau. To determine the states that spend the most on health and hospitals, researchers at HowtoHome.com calculated health and hospital spending as a share of total spending. In the event of a tie, the state with the greater total health and hospital spending per capita was ranked higher.
Here are the states that spend the most on health and hospitals.
States That Spend the Most on Health & Hospitals

15. Indiana
- Health & hospital spending as a share of total: 10.7%
- Total health & hospital spending per capita: $999
- Total health & hospital spending: $6,747,518,000
- Total direct expenditures: $62,806,487,000

14. Virginia
- Health & hospital spending as a share of total: 10.7%
- Total health & hospital spending per capita: $1,061
- Total health & hospital spending: $9,112,433,000
- Total direct expenditures: $85,243,956,000

13. Michigan
- Health & hospital spending as a share of total: 11.2%
- Total health & hospital spending per capita: $1,078
- Total health & hospital spending: $10,748,283,000
- Total direct expenditures: $95,700,844,000

12. Texas
- Health & hospital spending as a share of total: 11.3%
- Total health & hospital spending per capita: $1,013
- Total health & hospital spending: $29,753,376,000
- Total direct expenditures: $263,279,685,000

11. California
- Health & hospital spending as a share of total: 12.2%
- Total health & hospital spending per capita: $1,677
- Total health & hospital spending: $66,029,051,000
- Total direct expenditures: $541,102,413,000

10. Utah
- Health & hospital spending as a share of total: 12.8%
- Total health & hospital spending per capita: $1,289
- Total health & hospital spending: $4,190,560,000
- Total direct expenditures: $32,812,538,000

9. Iowa
- Health & hospital spending as a share of total: 14.0%
- Total health & hospital spending per capita: $1,557
- Total health & hospital spending: $4,925,808,000
- Total direct expenditures: $35,283,924,000

8. Washington
- Health & hospital spending as a share of total: 14.0%
- Total health & hospital spending per capita: $1,623
- Total health & hospital spending: $12,487,009,000
- Total direct expenditures: $89,455,201,000

7. Missouri
- Health & hospital spending as a share of total: 14.2%
- Total health & hospital spending per capita: $1,208
- Total health & hospital spending: $7,431,898,000
- Total direct expenditures: $52,380,770,000

6. Kansas
- Health & hospital spending as a share of total: 15.5%
- Total health & hospital spending per capita: $1,561
- Total health & hospital spending: $4,548,137,000
- Total direct expenditures: $29,333,928,000

5. Mississippi
- Health & hospital spending as a share of total: 17.1%
- Total health & hospital spending per capita: $1,597
- Total health & hospital spending: $4,736,972,000
- Total direct expenditures: $27,688,049,000

4. Alabama
- Health & hospital spending as a share of total: 18.7%
- Total health & hospital spending per capita: $1,687
- Total health & hospital spending: $8,302,347,000
- Total direct expenditures: $44,406,818,000

3. North Carolina
- Health & hospital spending as a share of total: 18.8%
- Total health & hospital spending per capita: $1,665
- Total health & hospital spending: $17,650,732,000
- Total direct expenditures: $93,667,411,000

2. Wyoming
- Health & hospital spending as a share of total: 18.9%
- Total health & hospital spending per capita: $2,936
- Total health & hospital spending: $1,709,488,000
- Total direct expenditures: $9,029,287,000

1. South Carolina
- Health & hospital spending as a share of total: 19.3%
- Total health & hospital spending per capita: $1,787
- Total health & hospital spending: $9,326,575,000
- Total direct expenditures: $48,273,596,000
Detailed Findings & Methodology
The data used in this analysis is from the U.S. Census Bureau’s 2020 Annual Survey of State and Local Government Finances. To determine the states that spend the most on health and hospitals, researchers at HowtoHome.com calculated health and hospital spending as a share of total spending. The two categories used to define health care spending were hospitals and health, which were summed together. Total spending was defined as direct general expenditure. In the event of a tie, the state with the greater total health and hospital spending per capita was ranked higher. A full list of definitions from the survey can be found here.
https://infogram.com/1plxz0xpd9ejg2bqwpl3zv3vqyiz1y6g70j?live