U.S. States With the Largest Increase in Labor Productivity Over the Last Decade

After an apparent boom during the COVID-19 pandemic in 2020, labor productivity in the U.S. economy has been underwhelming since. The U.S. Bureau of Labor Statistics has reported declining labor productivity for three of the last five quarters, and the most recent report only found growth of 0.3% in the third quarter of 2022.
The dramatic increase in productivity during the early months of the COVID-19 pandemic was in part a function of which workers were working. Jobs that have lower levels of labor productivity—measured as real output per labor hour—were more likely to confront layoffs or reductions in hours. In contrast, jobs in fields that are measured as highly economically productive often transitioned more easily to remote work.
Now, many companies in productive fields are shedding workers. Major companies like Meta, Amazon, and Microsoft—which operate in the technology field, a field that generates a high amount of outputs relative to labor costs—have announced large layoffs in 2022. Simultaneously, the labor market remains tight in other industries that are not as economically productive.
These trends in the composition and productivity of the labor market are significant indicators for the U.S. economy. Producing more goods and services with less labor helps businesses generate profit, expands choices and lowers prices for consumers, and can theoretically raise wages for workers. However, on the latter count, data shows that the relationship between productivity and wage growth has become weaker over time.
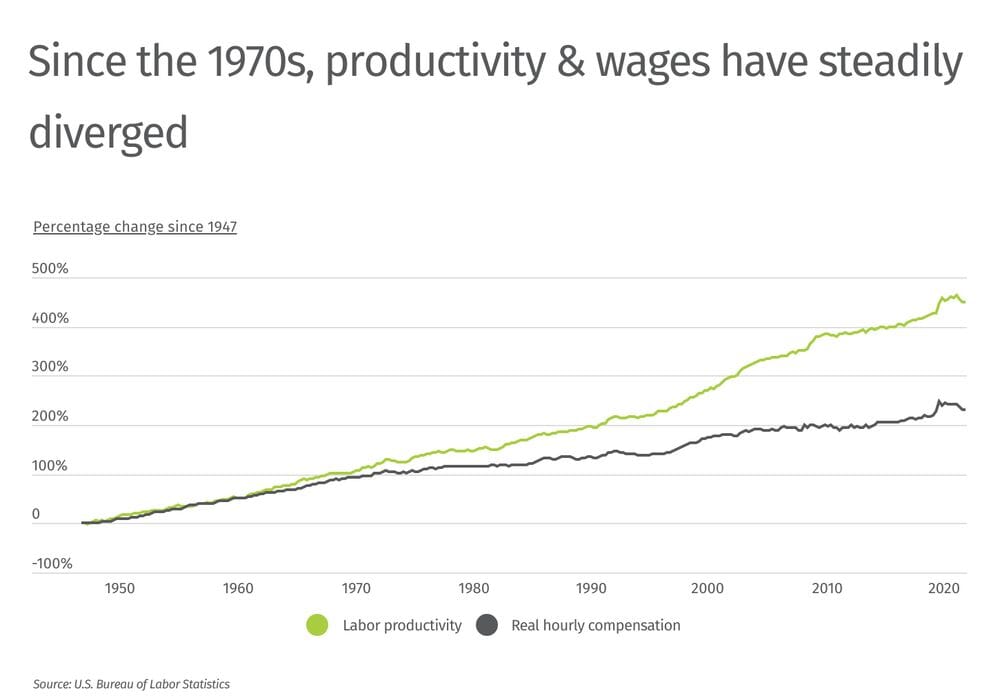
From the 1940s to the early 1970s, steady growth in labor productivity tracked closely with growth in real hourly compensation. However, over the last half-century, the rate of growth for labor productivity has continued to increase, while wage growth has stagnated. As a result, there is now a gap between productivity and wages. While productivity has grown by nearly 450% since the late 1940s, real hourly wages have grown by only 229% over the same period.
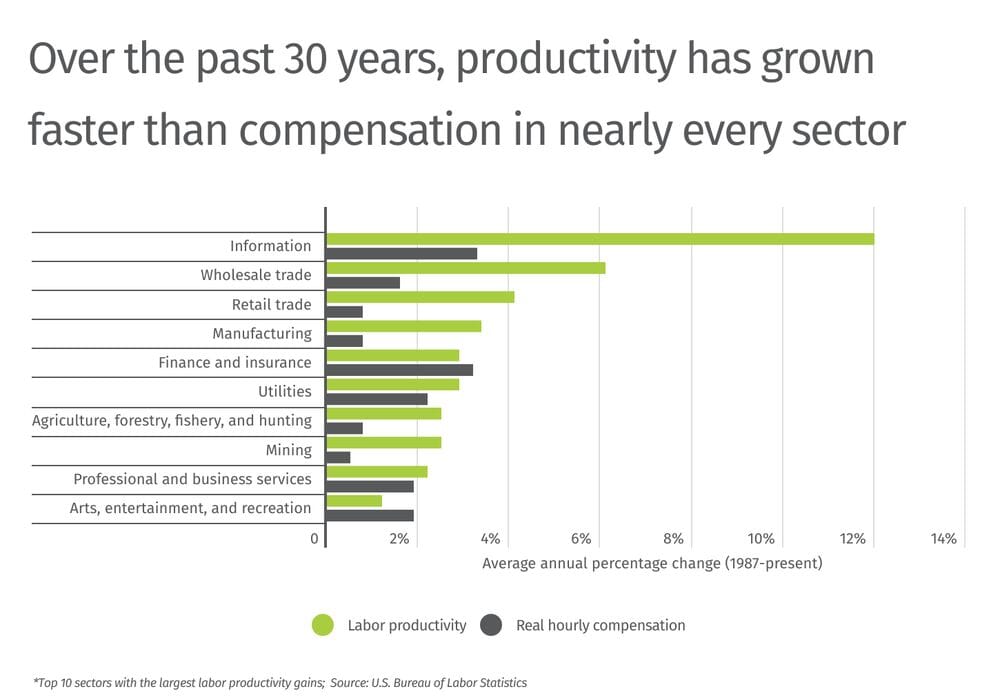
The phenomenon of the productivity-compensation gap is apparent in sectors across the economy. Nearly every industry shows a faster rate of growth in productivity than in wages over the last few decades, with finance and the arts being the major exceptions.
The information sector stands out as the industry with the largest gap: since 1987, the information sector has averaged 12% annual growth in productivity but just 3.3% growth in wages annually. With advances around computing, internet access, mobile devices, and more making technology an essential part of life and commerce, productivity in related information businesses has exploded. The information industry has had faster annual wage growth than any other sector, but even with that being the case, productivity gains easily outpace wage increases in recent years.
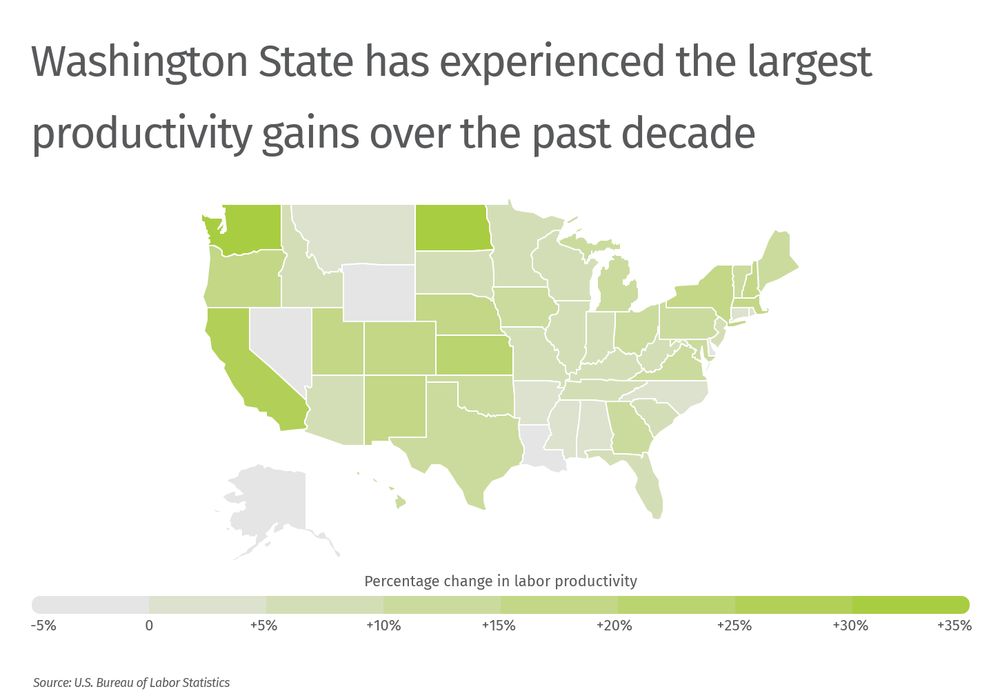
Differences in industry composition also help explain the places where productivity gains have been most pronounced recently. Washington and California, two states that have economies that are highly dependent on the information sector, respectively rank first and third in the percentage change in labor productivity over the last decade at 32.2% and 28.4%. Meanwhile, five states have actually seen negative growth in productivity in recent years. At the bottom of the list is Wyoming, where labor productivity declined by 5.1%.
The data used in this analysis is from the U.S. Bureau of Labor Statistics. To identify the states with the largest increase in labor productivity over the last decade, researchers at HowtoHome.com calculated the percentage change in the BLS labor productivity index between 2011 and 2021. In the event of a tie, the state with the greater change in real value-added output was ranked higher.
Here are the states with the largest increase in labor productivity over the last decade.
States With the Largest Productivity Gains

15. Pennsylvania
- Percentage change in labor productivity: +12.6%
- Percentage change in real value-added output: +16.6%
- Percentage change in hours worked: +3.6%
- Percentage change in real hourly compensation: +13.7%

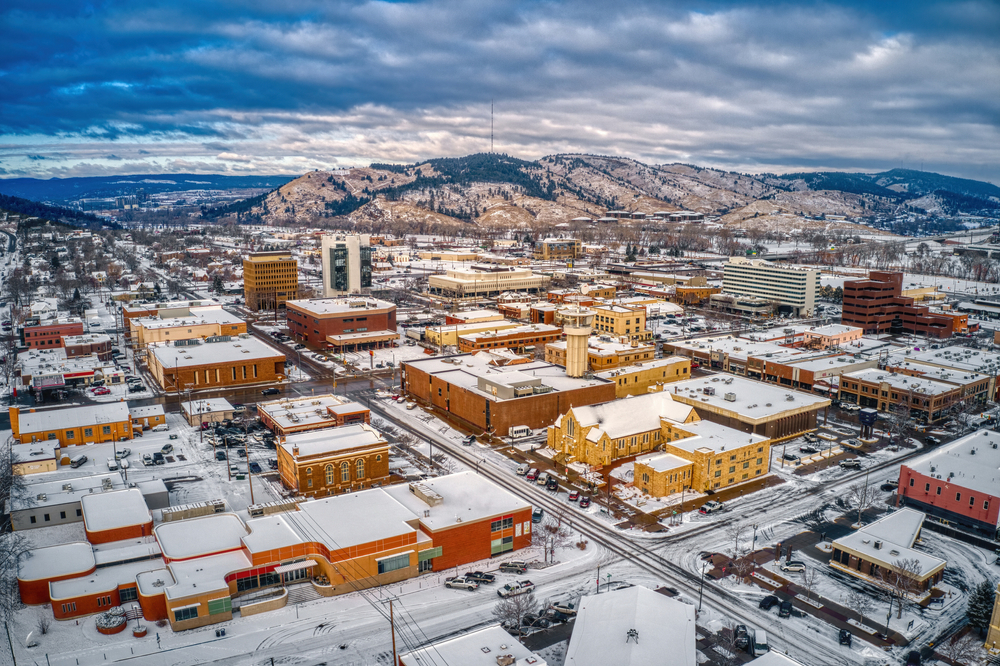
14. Iowa
- Percentage change in labor productivity: +13.9%
- Percentage change in real value-added output: +18.7%
- Percentage change in hours worked: +4.2%
- Percentage change in real hourly compensation: +14.1%

13. Texas
- Percentage change in labor productivity: +14.7%
- Percentage change in real value-added output: +37.7%
- Percentage change in hours worked: +20.1%
- Percentage change in real hourly compensation: +14.0%

12. Utah
- Percentage change in labor productivity: +15.4%
- Percentage change in real value-added output: +51.4%
- Percentage change in hours worked: +31.2%
- Percentage change in real hourly compensation: +27.4%
11. New Mexico
- Percentage change in labor productivity: +15.5%
- Percentage change in real value-added output: +15.7%
- Percentage change in hours worked: +0.2%
- Percentage change in real hourly compensation: +19.0%

10. Oregon
- Percentage change in labor productivity: +16.4%
- Percentage change in real value-added output: +34.9%
- Percentage change in hours worked: +15.9%
- Percentage change in real hourly compensation: +19.3%

9. New York
- Percentage change in labor productivity: +18.0%
- Percentage change in real value-added output: +20.9%
- Percentage change in hours worked: +2.5%
- Percentage change in real hourly compensation: +18.8%
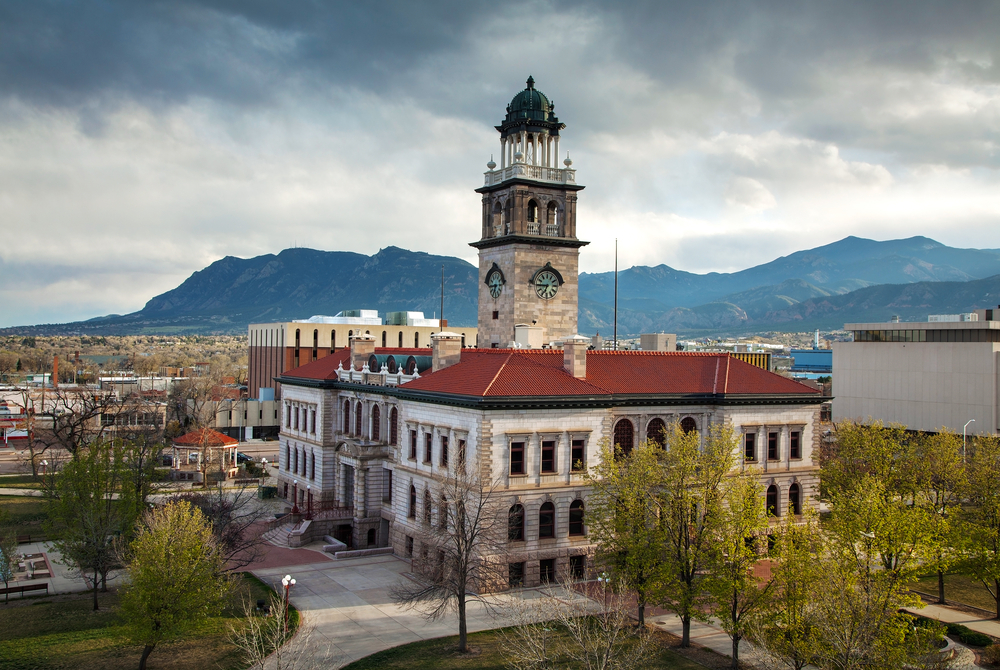
8. Colorado
- Percentage change in labor productivity: +18.0%
- Percentage change in real value-added output: +40.0%
- Percentage change in hours worked: +18.7%
- Percentage change in real hourly compensation: +23.5%

7. Nebraska
- Percentage change in labor productivity: +18.3%
- Percentage change in real value-added output: +22.4%
- Percentage change in hours worked: +3.5%
- Percentage change in real hourly compensation: +22.7%

6. Massachusetts
- Percentage change in labor productivity: +19.1%
- Percentage change in real value-added output: +28.5%
- Percentage change in hours worked: +7.8%
- Percentage change in real hourly compensation: +15.7%

5. New Hampshire
- Percentage change in labor productivity: +19.3%
- Percentage change in real value-added output: +27.3%
- Percentage change in hours worked: +6.7%
- Percentage change in real hourly compensation: +21.6%

4. Kansas
- Percentage change in labor productivity: +20.2%
- Percentage change in real value-added output: +21.4%
- Percentage change in hours worked: +1.0%
- Percentage change in real hourly compensation: +15.6%
 Photo Credit: yhelfman / Shutterstock
3. California
- Percentage change in labor productivity: +28.4%
- Percentage change in real value-added output: +48.9%
- Percentage change in hours worked: +16.0%
- Percentage change in real hourly compensation: +27.7%
2. North Dakota
- Percentage change in labor productivity: +30.3%
- Percentage change in real value-added output: +34.2%
- Percentage change in hours worked: +3.0%
- Percentage change in real hourly compensation: +12.3%

1. Washington
- Percentage change in labor productivity: +32.2%
- Percentage change in real value-added output: +56.6%
- Percentage change in hours worked: +18.5%
- Percentage change in real hourly compensation: +28.8%
Methodology & Detailed Findings
The data used in this analysis is from the U.S. Bureau of Labor Statistics Office of Productivity and Technology data series. To identify the states with the largest increase in labor productivity over the last decade, researchers calculated the percentage change in the labor productivity index between 2011 and 2021. In the event of a tie, the state with the greater change in real value-added output was ranked higher. All state-level data included is for private, nonfarm businesses only. For a more detailed description of the variables used in the survey, please refer to the Productivity Glossary on the BLS website.
https://infogram.com/1p0y2ky3wl977jse6mzmp9g52lsn353mly6?live