Affordable Cities With the Most 6-Figure Jobs

Over the last two years, U.S. workers have contended with one of the most unusual economic environments in memory.
On one hand, persistent tightness in the labor market has provided greater opportunity and wage growth for many workers. The unemployment rate today sits at just 3.7%, but the economy nonetheless continues to add hundreds of thousands of jobs each month. In efforts to recruit and retain workers in this environment, many employers have been boosting wages, especially for lower-earning workers.
But the highest levels of inflation in decades have eaten into workers’ gains. Year-over-year increases in the Consumer Price Index have topped 5% for every month since May 2021, peaking at 9.1% in June 2022. And many of the categories where costs have risen fastest are necessities that take up a large portion of household budgets, like shelter and groceries.
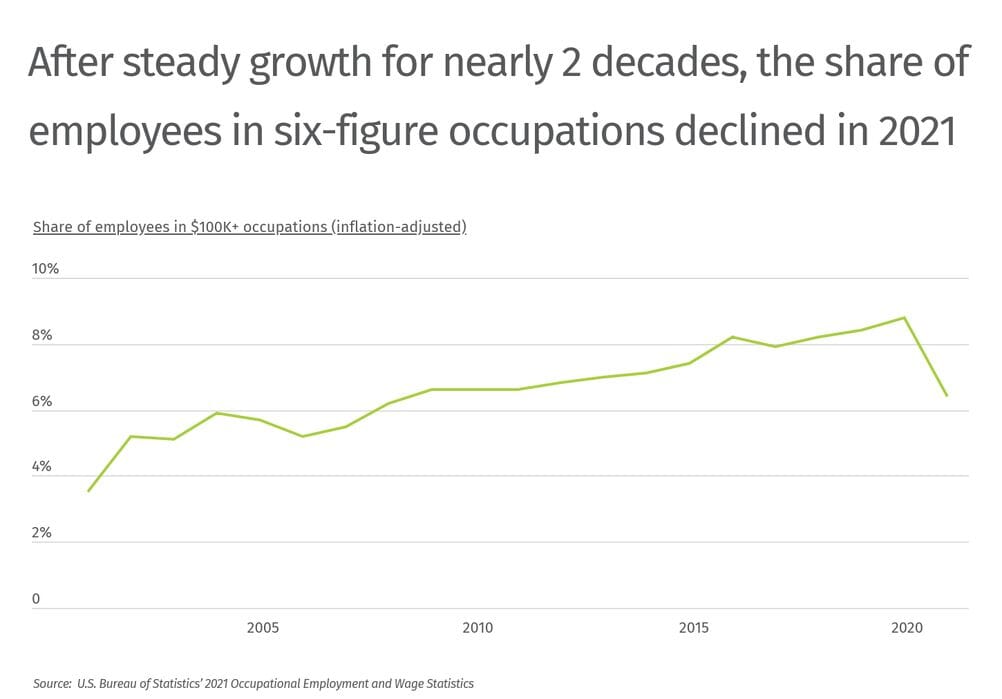
While lower-earning workers have struggled the most, even high earners have been impacted. After nearly two decades of steady growth, the share of workers in “six-figure” occupations—those with median annual wages of $100,000 or more in 2021 dollars—declined sharply last year. After reaching an inflation-adjusted peak at 8.8% in 2020, 2021’s share was just 6.4%.
In light of inflation’s impacts, many workers have sought out better-paying occupations. But many of the fields with the most demand for workers may not offer major increases in salary: according to the Bureau of Labor Statistics (BLS), the majority of the fastest-growing occupations earn well under $100,000 per year.
For workers seeking both plentiful job opportunities and high wages, fields in science, technology, engineering, and mathematics (STEM) are their best bet. The BLS projects 10.8% employment growth in STEM jobs by 2031, with median wages of $95,420, compared to 4.9% growth and $40,120 in pay for all other fields.
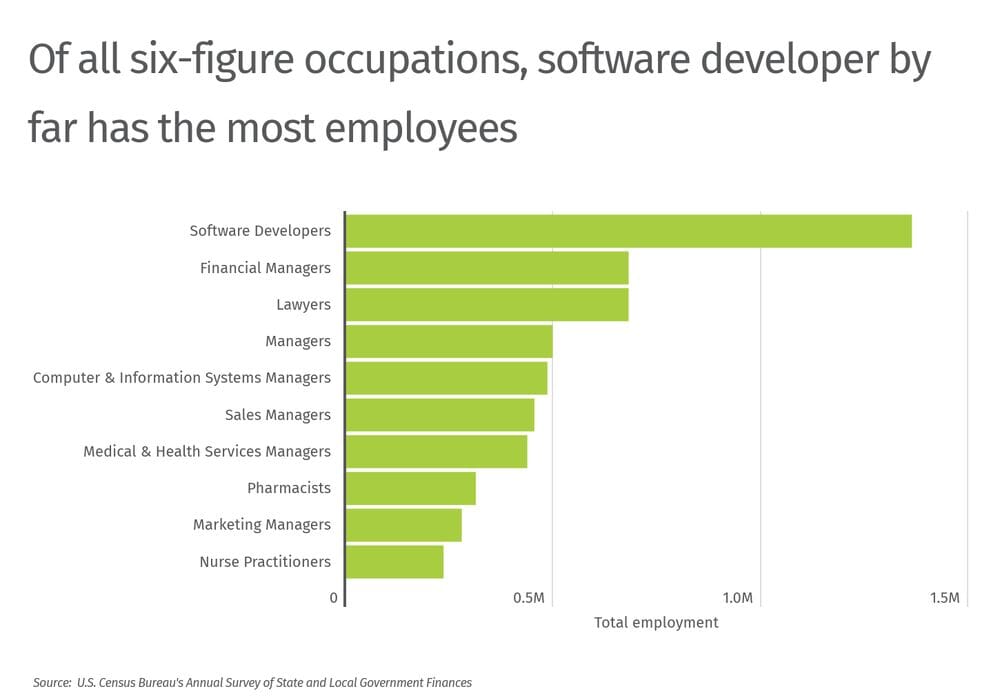
And one of the most promising jobs of all is software development. The U.S. currently employs around 1.3 million software developers, who earn a median wage of $120,730. Additionally, the outlook for software developers is bright as employment in the field is projected to grow by 26% by 2031—significantly faster than the projected growth for all occupations on average. Other STEM jobs including computer and information systems managers, medical and health service managers, and pharmacists also rank highly for jobs with six-figure earners.
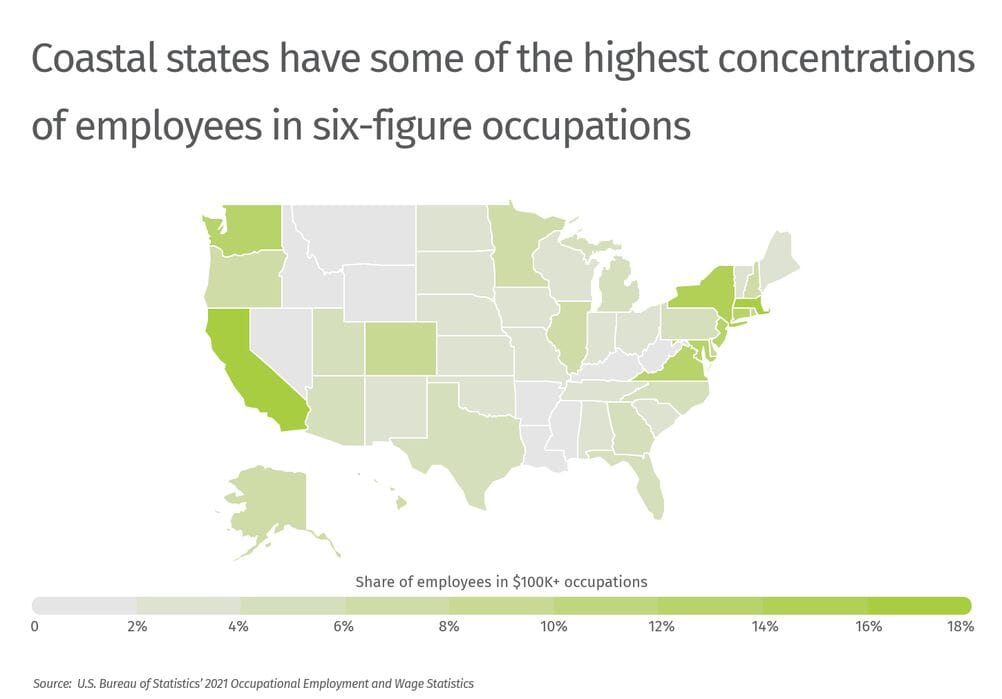
Due to differences in states’ industry makeup, the concentration of high-earning workers can vary substantially by geography. States that have more workers in well-compensated fields like tech, finance, health, or law tend to have the greatest share of workers bringing in more than $100,000 annually. Massachusetts leads the nation with a 17.3% share, followed by California at 16.6% and New York at 14.1%.
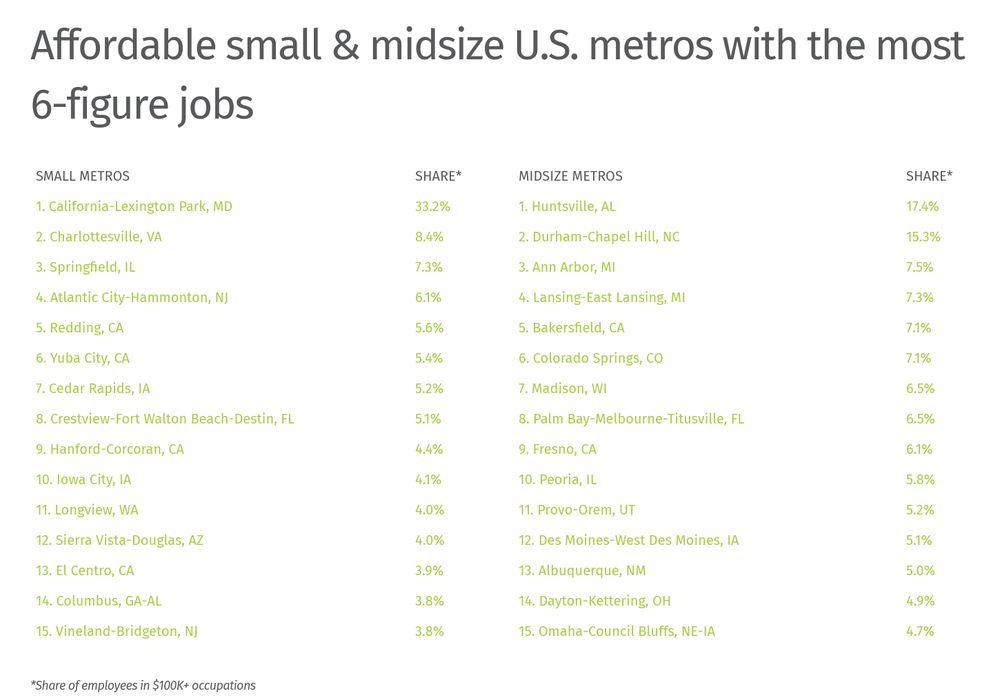
A six-figure job will put workers in a comfortable financial position in almost every part of the country, but due to differences in cost of living, a six-figure salary goes further in some places. Residents in these ideal locations enjoy both a large number of well-paying jobs and a cost of living below the national average, allowing them to make the most of their money. Many of the cities where this is the case are found in Southeastern states that have boomed recently with job growth in fields like tech, finance, and health sciences. North Carolina stands out, with its two largest metros of Raleigh and Charlotte topping the list of affordable cities with the most six-figure jobs. And while the fast-growing Sun Belt features prominently on the list, a number of Rust Belt locations including Detroit, Milwaukee, and Cincinnati also rank highly.
The data used in this analysis is from the U.S. Bureau of Statistics and the U.S. Bureau of Economic Analysis. To determine the affordable metropolitan areas with the most six-figure jobs, researchers at HowtoHome.com calculated the share of employees in occupations where the median wage is over $100,000 and the cost of living is below the national average. In the event of a tie, the location with the greater total number of employees in occupations where the median wage is over $100,000 was ranked higher.
Here are the affordable U.S. metropolitan areas with the most six-figure jobs.
Affordable Large U.S. Metros With the Most 6-Figure Jobs

15. Tampa-St. Petersburg-Clearwater, FL
- Share of employees in $100K+ occupations: 4.6%
- Total employees in $100K+ occupations: 59,620
- Total employees across all occupations: 1,289,900
- Average wage for employees in $100K+ occupations: $119,365
- Cost of living (compared to average): -0.9%

14. Pittsburgh, PA
- Share of employees in $100K+ occupations: 4.8%
- Total employees in $100K+ occupations: 49,550
- Total employees across all occupations: 1,043,000
- Average wage for employees in $100K+ occupations: $122,515
- Cost of living (compared to average): -4.3%

13. Kansas City, MO-KS
- Share of employees in $100K+ occupations: 5.1%
- Total employees in $100K+ occupations: 52,030
- Total employees across all occupations: 1,016,160
- Average wage for employees in $100K+ occupations: $122,480
- Cost of living (compared to average): -5.3%

12. Rochester, NY
- Share of employees in $100K+ occupations: 5.2%
- Total employees in $100K+ occupations: 24,310
- Total employees across all occupations: 471,020
- Average wage for employees in $100K+ occupations: $126,099
- Cost of living (compared to average): -1.7%

11. Cleveland-Elyria, OH
- Share of employees in $100K+ occupations: 5.2%
- Total employees in $100K+ occupations: 49,820
- Total employees across all occupations: 963,990
- Average wage for employees in $100K+ occupations: $124,335
- Cost of living (compared to average): -7.0%

10. Columbus, OH
- Share of employees in $100K+ occupations: 5.3%
- Total employees in $100K+ occupations: 54,330
- Total employees across all occupations: 1,022,310
- Average wage for employees in $100K+ occupations: $123,782
- Cost of living (compared to average): -5.8%

9. Cincinnati, OH-KY-IN
- Share of employees in $100K+ occupations: 5.7%
- Total employees in $100K+ occupations: 58,680
- Total employees across all occupations: 1,023,830
- Average wage for employees in $100K+ occupations: $124,417
- Cost of living (compared to average): -6.5%

8. Salt Lake City, UT
- Share of employees in $100K+ occupations: 6.1%
- Total employees in $100K+ occupations: 45,530
- Total employees across all occupations: 743,170
- Average wage for employees in $100K+ occupations: $124,524
- Cost of living (compared to average): -2.3%

7. Milwaukee-Waukesha, WI
- Share of employees in $100K+ occupations: 6.5%
- Total employees in $100K+ occupations: 50,910
- Total employees across all occupations: 786,640
- Average wage for employees in $100K+ occupations: $121,877
- Cost of living (compared to average): -4.1%

6. Nashville-Davidson–Murfreesboro–Franklin, TN
- Share of employees in $100K+ occupations: 7.3%
- Total employees in $100K+ occupations: 71,600
- Total employees across all occupations: 976,900
- Average wage for employees in $100K+ occupations: $127,707
- Cost of living (compared to average): -3.0%

5. Atlanta-Sandy Springs-Alpharetta, GA
- Share of employees in $100K+ occupations: 7.7%
- Total employees in $100K+ occupations: 200,060
- Total employees across all occupations: 2,587,890
- Average wage for employees in $100K+ occupations: $120,481
- Cost of living (compared to average): -1.8%

4. Richmond, VA
- Share of employees in $100K+ occupations: 8.0%
- Total employees in $100K+ occupations: 49,400
- Total employees across all occupations: 617,020
- Average wage for employees in $100K+ occupations: $125,655
- Cost of living (compared to average): -4.6%
3. Detroit-Warren-Dearborn, MI
- Share of employees in $100K+ occupations: 8.7%
- Total employees in $100K+ occupations: 156,000
- Total employees across all occupations: 1,801,530
- Average wage for employees in $100K+ occupations: $120,756
- Cost of living (compared to average): -2.9%

2. Charlotte-Concord-Gastonia, NC-SC
- Share of employees in $100K+ occupations: 11.7%
- Total employees in $100K+ occupations: 141,090
- Total employees across all occupations: 1,209,890
- Average wage for employees in $100K+ occupations: $124,459
- Cost of living (compared to average): -5.4%

1. Raleigh-Cary, NC
- Share of employees in $100K+ occupations: 11.8%
- Total employees in $100K+ occupations: 74,860
- Total employees across all occupations: 633,260
- Average wage for employees in $100K+ occupations: $122,832
- Cost of living (compared to average): -4.3%
Detailed Findings & Methodology
The data used in this analysis is from the U.S. Bureau of Statistics’ Occupational Employment and Wage Statistics and the U.S. Bureau of Economic Analysis’ Regional Price Parities. To determine the affordable metropolitan areas with the most 6-figure jobs, researchers at HowtoHome.com calculated the share of employees in occupations where the median wage is over $100,000 and the cost of living is below the national average. In the event of a tie, the location with the greater total number of employees in occupations where the median wage is over $100,000 was ranked higher. To improve relevance, only metropolitan areas with at least 100,000 residents were included. Additionally, metros were grouped into cohorts based on population size: small (100,000–349,999), midsize (350,000–999,999), and large (1,000,000 or more).
https://infogram.com/1pddj02jvywdkntmzmr62enkygakdzjkgq2?live