States Spending the Most on Childcare

The last few years have been tough on working parents. Daycare and school closures during the COVID-19 pandemic forced parents to rearrange their work schedules, reduce their hours, or even leave the workforce entirely. As a result, childcare came into focus as an essential part of a well-functioning labor market and the broader economy. And in response, policymakers expanded the Child Tax Credit to provide additional financial assistance for families with kids, but the payments have since reverted to previous levels.
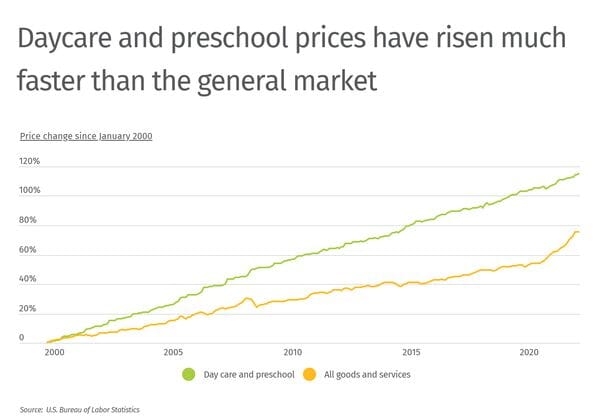
Over the past two decades, childcare costs have risen much faster than overall prices. Between 2000 and 2021, prices for all goods and services increased by 76%, while prices for daycare and preschool climbed by nearly 120%. Today, American families with children 13 and under spend a median $6,000 (or 5.3% of their income) on childcare annually, according to data from the Census Bureau’s Current Population Survey.
The expanded Child Tax Credit, part of the American Rescue Plan, increased the Child Tax Credit from $2,000 to either $3,600 (for children under age 6) or $3,000 (for other children under age 18 in 2021). The American Rescue Plan also increased the Child and Dependent Care Tax Credit, which helps to offset childcare expenses, up to $5,900 or higher. However, while there is federal support to renew these credits, starting in 2022, both credits have reverted to previous levels while many families are facing large childcare costs, record-high inflation, and other economic uncertainties.
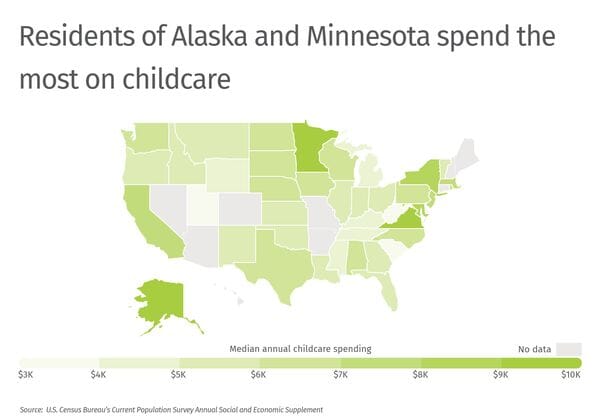
While median annual childcare spending is $6,000 overall among families with kids 13 and under, childcare costs vary across the U.S. In certain states, median annual childcare spending tops $9,000. Families with children 13 and under in Alaska and Minnesota spend $9,600 and $9,400, respectively, on childcare expenses. Meanwhile, childcare is much more affordable in other parts of the country such as West Virginia where families spend just $3,000 on annual childcare expenses.
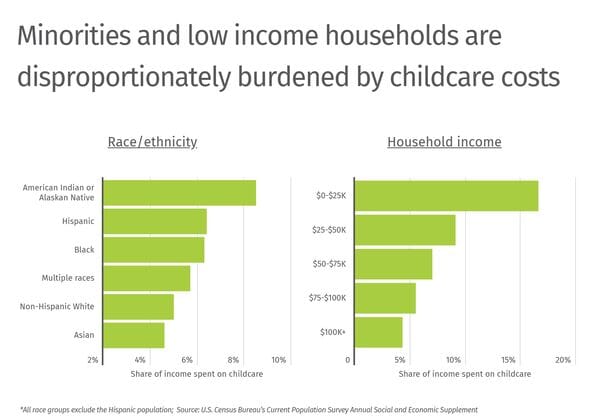
High childcare costs have disproportionate impacts on low-income families and racial minorities, many of whom allocate significantly more than 7% of their income to childcare—the threshold used by the U.S. Department of Health and Human Services to assess childcare affordability. American Indian and Alaskan Native families spend 8.5% of their income on childcare while non-Hispanic White families spend 5% and Asian families spend just 4.6%. Households earning less than $25,000 spend nearly 17% of their income on childcare while households earning $100,000 or more spend just 4.3%.
To determine the states with the most and least affordable childcare, researchers at HowtoHome.com analyzed the latest data from the U.S. Census Bureau’s Current Population Survey. The researchers ranked states according to the median share of household income spent on childcare, among households with children 13 and under who spent money on childcare. Researchers also calculated median annual childcare spending and median annual household income for the same group of households.
States Spending the Most on Childcare

15. Pennsylvania
- Share of income spent on childcare: 5.6%
- Median annual childcare spending: $6,000
- Median annual income: $100,501

14. Tennessee
- Share of income spent on childcare: 5.7%
- Median annual childcare spending: $4,800
- Median annual income: $77,313

13. Florida
- Share of income spent on childcare: 6.0%
- Median annual childcare spending: $5,000
- Median annual income: $75,681

12. Louisiana
- Share of income spent on childcare: 6.0%
- Median annual childcare spending: $5,180
- Median annual income: $72,501

11. Georgia
- Share of income spent on childcare: 6.0%
- Median annual childcare spending: $5,200
- Median annual income: $74,041

10. Texas
- Share of income spent on childcare: 6.2%
- Median annual childcare spending: $6,000
- Median annual income: $81,816

9. South Dakota
- Share of income spent on childcare: 6.3%
- Median annual childcare spending: $6,300
- Median annual income: $100,027

8. North Dakota
- Share of income spent on childcare: 6.3%
- Median annual childcare spending: $6,600
- Median annual income: $95,048

7. Virginia
- Share of income spent on childcare: 6.4%
- Median annual childcare spending: $9,000
- Median annual income: $105,100

6. Iowa
- Share of income spent on childcare: 6.5%
- Median annual childcare spending: $6,500
- Median annual income: $100,000

5. Alaska
- Share of income spent on childcare: 6.5%
- Median annual childcare spending: $9,600
- Median annual income: $90,200

4. New York
- Share of income spent on childcare: 6.6%
- Median annual childcare spending: $8,320
- Median annual income: $100,000

3. Massachusetts
- Share of income spent on childcare: 6.7%
- Median annual childcare spending: $7,200
- Median annual income: $120,081

2. Alabama
- Share of income spent on childcare: 6.8%
- Median annual childcare spending: $6,000
- Median annual income: $75,000

1. North Carolina
- Share of income spent on childcare: 7.1%
- Median annual childcare spending: $6,400
- Median annual income: $87,126
Detailed Findings & Methodology
To find the states spending the most on childcare, researchers at HowtoHome.com analyzed the latest data from the U.S. Census Bureau’s 2022 Current Population Survey Annual Social and Economic Supplement. The researchers ranked states according to the median share of household income spent on childcare. In the event of a tie, the state with the larger median annual childcare spending was ranked higher. Researchers also calculated median annual household income. Only single-family households with children 13 and under were included in the analysis. Additionally, only locations with complete data available were included.
https://infogram.com/1pz1mnlgx2n2m1i21mq5pj72yrh17dj3x2p?live